

Choosing one from all the PR analytics tools on the market can be difficult if you're not sure what information you actually need. With all the capabilities available, it's imperative to search for one that best fits your business needs and is tailored to your own specific case.
In this article, you'll find what metrics and data a good PR tool should have, so that you can make your work easier when drafting data-driven strategies and showing off your progress to stakeholders and clients.
Try Prowly's media monitoring free for 7 days
Start tracking your brand and keywords for free (no credit card required) in Prowly.
- Comprehensive monitoring: Track the web and social media mentions.
- Transparent pricing: Plans start at $258/month
- All-in-one platform: Get everything you need in one tool for PR, incl. media database, outreach, reporting, and more
List of PR analytics tools
Here’s a brief table comparing the most popular PR analytics tools, their pricing, contract length and whether they have a free trial or not.
| Provider | Pricing | Contract length | Free trial |
| Prowly | From $258/mo | Monthly or yearly | Yes (7 days) |
| Muck Rack | $15,000/yr* | Yearly only | No |
| Meltwater | $15,000/yr* | Yearly only | No |
| Cision | From $10,000/yr* | Yearly only | No |
| Propel | From $2,400/yr | Yearly only | Yes |
| Prezly | From $90/mo | Monthly or yearly | Yes |
| Agility PR | Undisclosed | Yearly only | No |
| CoverageBook | From $99/mo | Monthly or yearly | Yes |
| Releasd | From $154/mo | Monthly or yearly | No |
What to consider when choosing a PR analytics tool?
We know data is king, so choosing between all the PR analytics tools on the market is a big task. Collecting mentions is one thing, but making sense of them is another.
With a solid PR analytics tool, you should be able to:
- Gather data from a wide range of media sources to get a holistic view of your brand's and competitor's presence in the media landscape.
- Get dozens of industry-relevant metrics such as sentiment analysis, share of voice, estimated reach, and advanced engagement metrics.
- Create easily customizable visual aids such as graphs, bar charts, and more, to make it easy for you and stakeholders to spot general trends and outliers.
Here is a more detailed breakdown of what you need to look for when browsing through PR analytics tools:
Data sources
By tracking mentions across various platforms, you can uncover opportunities to engage with different audiences and see if the strategy you have in place makes sense. This comprehensive approach allows for the identification of both high-performing content and areas where engagement is lacking, offering a clear roadmap for adjustment.
Therefore, finding analytics tools that cover as many data sources as possible is crucial in capturing wins, understanding failures, and everything in between. This broad data coverage helps ensure that no vital insights are overlooked, enhancing strategic decision-making.
For example, an up-and-coming tech company might focus on industry and tech blogs, whereas a niche fashion brand would look more toward social media channels. Tracking different platforms helps pinpoint where the conversations are most vibrant and relevant to your specific sector.
Or, what if the marketing department is focused on TikTok, but you see that your target audience is actually on Instagram? Having this knowledge can give you an edge in building a strategy that works. This ability to adapt based on real-time data can significantly impact your brand's relevance and engagement levels.
At Prowly, you can monitor:

- News
- Blogs
- Discussion forums
- TikTok
- Youtube
1. News and online outlets
If you're interested in monitoring news only, you can do just that at Prowly as well. Whether it's a new product announcement, breaking news about a celebrity, or a political statement and you're waiting on the public's response, there are things you can do to help you analyze the landscape.
First, start with creating a search query for several keywords related to your event. It could be a regular keyword, brand, a person that's involved in whatever is going on, and more. Then, you can create a dashboard to visualize what's happening in real time.
You can set up widgets that show mentions with positive sentiment, negative sentiment, quickly assess top mentions from tier 1 or tier 2 publications, see the audience reach of such an announcement, compare share of voice, and many more. Possibilities are endless, depending on what you need to track.
To sum it up, you should consider only the PR analytics tools that have comprehensive media monitoring capabilities with dozens of metrics available. That's the only way you'll be able to get the value PR analytics tools provide.
2. Social media monitoring
It's a given you can't do detailed media monitoring for your client and get them the PR analysis you want without tracking what conversations are happening on social media.
Understanding these dialogues is crucial in crafting PR strategies that highly resonate with current trends and public sentiment. Without these insights, agencies, in-house teams, and freelancers might miss critical opportunities to manage brand reputation and counteract negative perceptions as fast as they can.
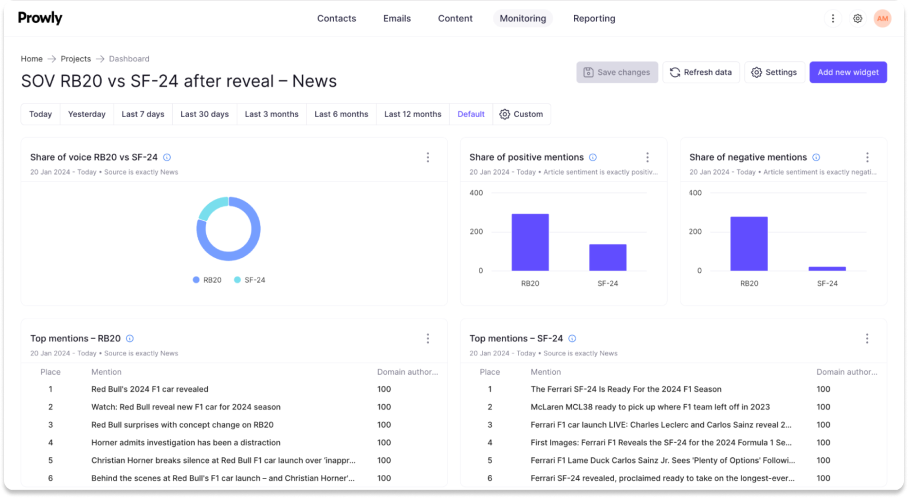
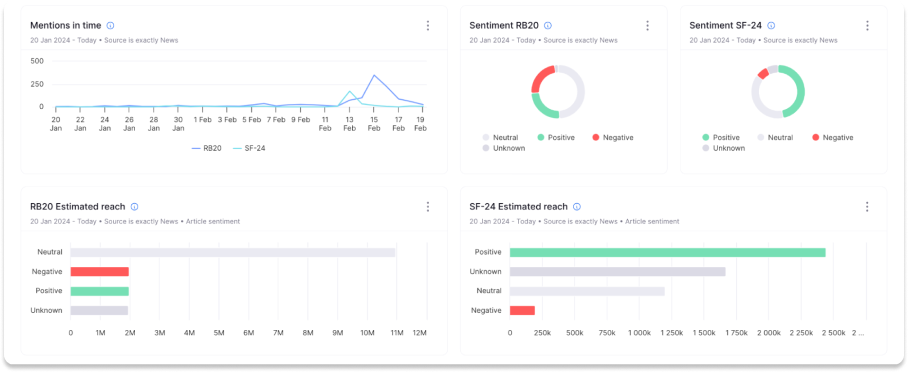
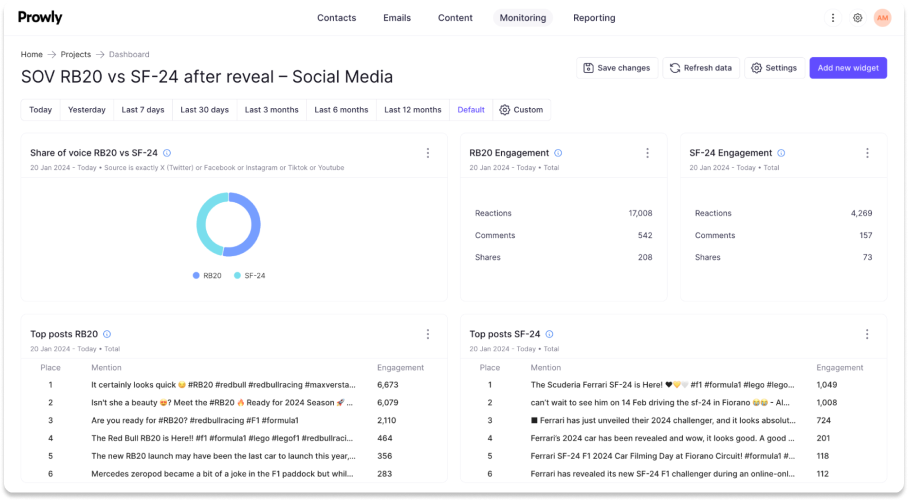
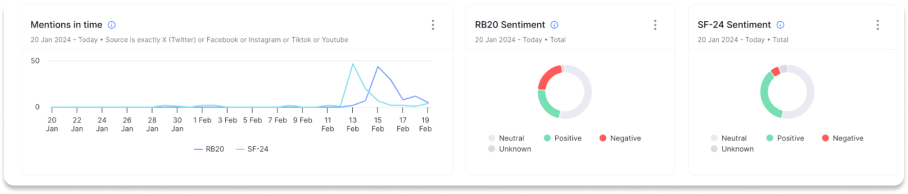
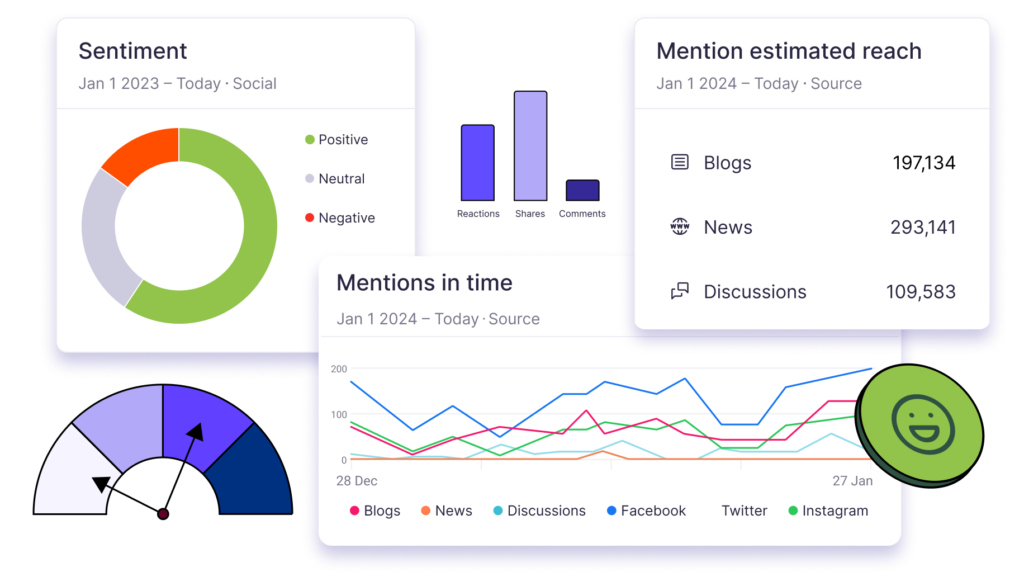
In order to see what kind of data you can get with the PR analytics tools, take a look at Prowly's dashboards.
In this specific example, we're comparing Red Bull and Ferrari's metrics. Since data visualization makes it easy to spot trends, you can instantly see that Red Bull has a much bigger share of voice in the news, and Ferrari takes the crown when it comes to the share of voice in social media channels.
However, what's interesting is that Red Bull's content on social media is much more engaging and generates more reactions. When it comes to sentiment, there isn't much of a difference in either of the channels for either of the brands.
While this is just a short sample analysis, the best PR analytics software will help you get such data to help you draw conclusions about your strategy early, so you can adjust it as you go.
Types of metrics
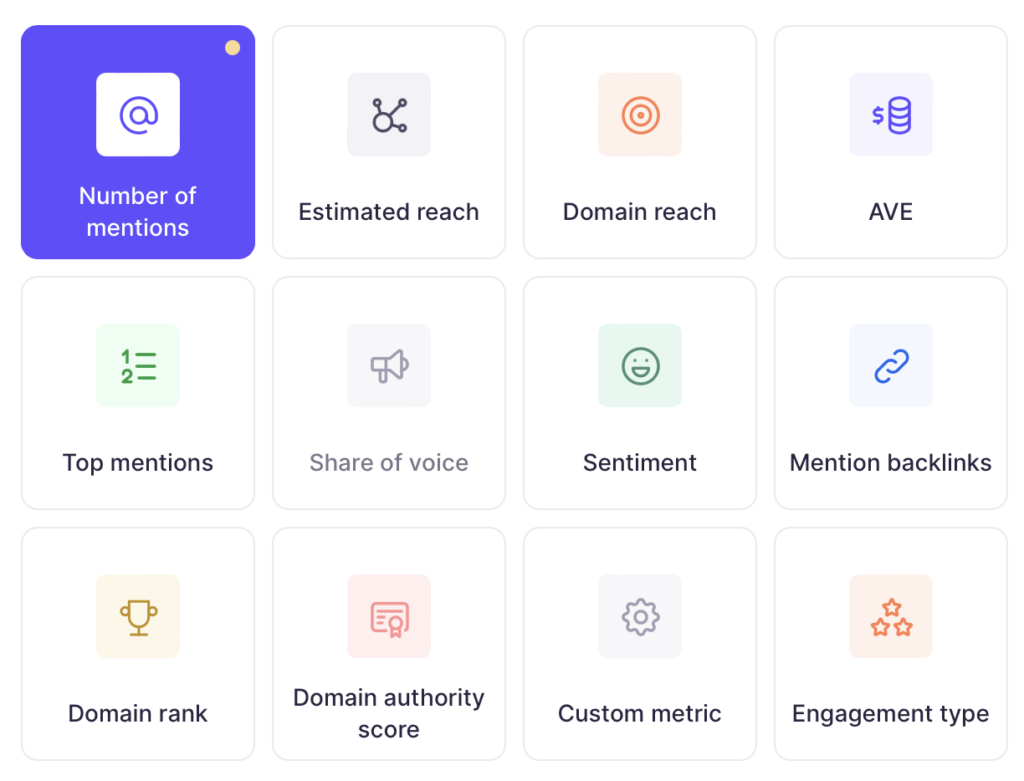
▪️AVE - short for Ad Value Equivalency, is a metric used to estimate the monetary worth of media coverage, benchmarking it with what the campaign or activities would cost if they were paid advertisements as opposed to organic.
While this is not a metric loved by many due to a plethora of limitations, AVE continues to be a prevalent method for evaluating the impact of all kinds of PR efforts.
▪️Backlinks - by using this metric, you can track the number of backlinks that direct back to your desired landing page. That way, you can assess the importance and popularity of your domain and potentially spot opportunities to get backlinks where they're lacking.
Although PR specialists say it's rare journalists would edit anything they wrote, it never hurts to try (you might have much more luck with more "lenient" publications though!).
▪️Domain authority score - here you can see a distribution of rankings of all media outlets where mentions were found. Generally, it's a search engine ranking score that determines how important a website is by measuring its potential to rank higher in search engines.
▪️Domain rank - this metric shows the domain ranking of outlets and news sources where you have been mentioned, assessing organic visibility based on their estimated monthly traffic. The lower the ranking number, the more significant the domain.
Keep in mind that mentions on higher-ranked domains can increase your chances of getting greater visibility, since these online sources have a wider audience.
▪️Domain reach - think of this as a quick snapshot of the outlet's traffic over a specific period. It tells you how many visitors have checked out a domain with your mention. Basically, if the number is high, that means a larger number of people are seeing the mention of your brand or selected keyword.
With this, you can strategically plan ahead to see what kind of publications are giving you more traction and compare this metric with others - maybe you have a niche subject and, although the domain reach of the website that has mentioned you is low, your impact is sky high?
▪️Estimated reach - here you'll simply see an estimate of the potential size of your audience for an article that contains the keyword you're interested in over the past month.
In order to evaluate the effectiveness of your strategy, you need a PR tool that will let you compare this metric across different campaigns or timeframes. Such an analysis will help you identify which publications may require more targeted outreach.
▪️Number of mentions - a sum of all the mentions for a given query. Prowly gives you the option to refine these results using filters like sentiment, estimated reach, domain rank, and more, allowing for a more detailed analysis.
▪️Sentiment - as one of the most important metrics for any type of PR analytics, filtering results by sentiment is a valuable tool for understanding the public's perception of your specific campaign, brand, competitors, or just about anything else you're tracking.
It allows you to see whether your strategy, especially during events that involve a PR crisis, are influencing people's perceptions. Since this is a valuable metric, it's crucial to analyze it from each side.
You can do it with Prowly's filters and, for example, get a clear understanding of how sentiment looks as sorted by country to get deeper insights into how different regions might perceive your brand.
▪️Share of Voice - also commonly known as SoV, this metric measures your brand's visibility and awareness by tracking the number of times your brand is mentioned in the media.
High-quality PR analytics tools will provide the option of breaking it down by the different media and channels you use so that you get a clear understanding of where your share of voice is high and where it needs work.
It's a clear indicator of a campaign's effectiveness and can show how mentions increase post-campaign in comparison to previous periods. Actually, there are many ways in which you can implement it, all depending on your strategy.
It also helps assess your brand's competitive authority. By comparing your own SoV to that of your competitors, you can easily identify which brands are the most influential, which topics resonate with your target audience, and so on.
▪️Top mentions - a metric that shows top mentions helps to easily spot top-performing articles. At Prowly, you can filter by AVE, estimated reach, domain reach, domain rank, and domain authority score. It will contain all the mentions you've found in a media monitoring query for a brand, person, competitor, or keyword of your interest.
Additional metrics for social media
▪️Engagement type - this metric measures the extent of user interactions with social media content, while focusing on how actively users are engaging with it rather than just passively scrolling. It considers interactions such as comments, reactions, and shares - depending on the social media platform.
Tracking this metric can provide you with a level of audience engagement, providing insights into how interesting or relatable content is. Without it, it's nearly impossible to understand the effectiveness of PR social media strategies.
▪️Post sentiment - this one works exactly the same as sentiment for news and other types of sources, but you can divide it per social media platform you're interested in. Basically, you can compare sentiment across Instagram vs. Facebook, or other media channels, if that's what your campaign requires.
▪️Top posts - find the top 10 social media posts for your query. Such features in a media monitoring tool can help you quickly assess best-performing posts in terms of engagement and evaluate whether or not your strategy is working.
It's also a great way to see what post has a chance to reach a wider audience. To make it even more useful, you can sort it by either the number of followers a particular account has or engagement (which is a formula based on the sum of likes, comments, and shares).
Data visualization
Illustrating the effectiveness of public relations with hard numbers has traditionally posed a challenge, yet visual representations significantly aid in making this clearer.
Nothing, but I mean absolutely nothing beats visualizing metrics.
Because some of them might not mean a lot to your stakeholders, seeing a simple graph or a chart with all the information can help identify patterns, trends, and anomalies you wouldn't have seen otherwise. Visual data presentations not only clarify the impact of PR efforts but also substantiates the strategic decisions behind them, making it easier for stakeholders to appreciate and understand the ROI.
Prowly's PR analytics software helps you create a dashboard for each project and customize it to your preference. There are lots of metrics you can choose from, such as estimated reach, SoV, sentiment analysis, engagement type, and many more.
This customization allows users to focus on the most relevant metrics to their specific needs, enabling a more targeted and effective analysis. Additionally, having all these metrics in one place simplifies the reporting process and increases the efficiency of communication with team members and clients.
Once you're done finding mentions in Prowly's Media Monitoring, you can create comprehensive dashboards which not many PR analytics tools provide. To visualize data even more easily, you can view:
- Line graphs - beneficial when you want to see staggered data, like the comparison of a domain's estimated reach vs. their rank, and then further filter it by a selected date range.
- Bar graphs - great for breaking down sentiment and visually assessing how much positive, negative, and neutral sentiment your query has received.
- Donut chart - can be used similarly to the above examples, depending on the visualization you prefer.
- Stacked area graph - similar to line graphs, but can show trends across time. Great to use with additional breakdowns for even more meticulous PR analytics.
- Column chart - another way to visualize data, for example, to show the estimated reach of a campaign divided by media sources.
Reporting capabilities
Picture this: you're up against a deadline, coffee in one hand, mouse in the other, and you're racing to put together a presentation that will impress your clients. You find yourself shuffling between different programs, and the entire process looks more like navigating through different tools instead of creating a simple report.
This juggling act can be frustrating and inefficient, often leading to errors and consuming valuable time. However, it doesn't need to feel like this. With the right tool, you'll be able to create an engaging presentation quickly and efficiently, with data-driven insights, all in one place.
You should never need to use external platforms, manually search for clippings, take screenshots, and use PowerPoint to design your reports. By streamlining these processes into one tool, you can focus more on the content and quality of your presentation, rather than on the mechanics of assembling it.
What you want is a tool that will allow you to effortlessly integrate screenshots and then social media posts and even include videos right in your report. The idea is to have everything you need in one integrated space.
This not only simplifies your workflow but also ensures that your final presentation is both comprehensive and professional, making it easier to communicate your insights effectively. Such a tool can transform the challenge of report creation into an opportunity for showcasing your analytical and creative skills.
The best PR analytics tools
Below you can find the list of the most popular PR analytics tools on the market:
- Prowly
- MuckRack
- Meltwater
- Cision
- Propel
- Prezly
- Agility PR
- CoverageBook
- Releasd
PR Analytics tool #1: Prowly
| Provider | Pricing | Contract length |
| Prowly | From $258/mo | Monthly or yearly |
Prowly stands out because it's sort of a comprehensive tool kit equipped with a dedicated reporting feature that streamlines the creation of visually beautiful coverage reports without hassle.
It offers the flexibility to incorporate interactive elements, making sure your reports not only deliver information but also engage their recipient. With different sharing options and an option to protect your report with a password, you'll never have to worry about leaking any confidential information or putting stats in the hands of someone who shouldn't have them.
The convenience of automatically tracking metrics and including press clippings directly from Prowly's Media Monitoring tool also saves time and ensures all the data is accurate and free of any errors. That way, you can enrich your content and provide a broader view of your impact as a PR expert.
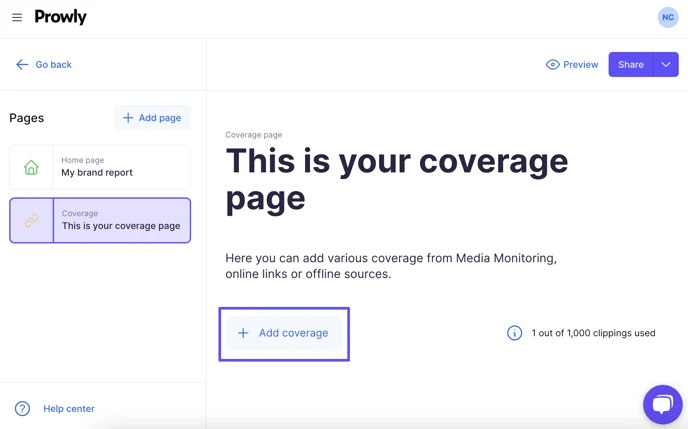
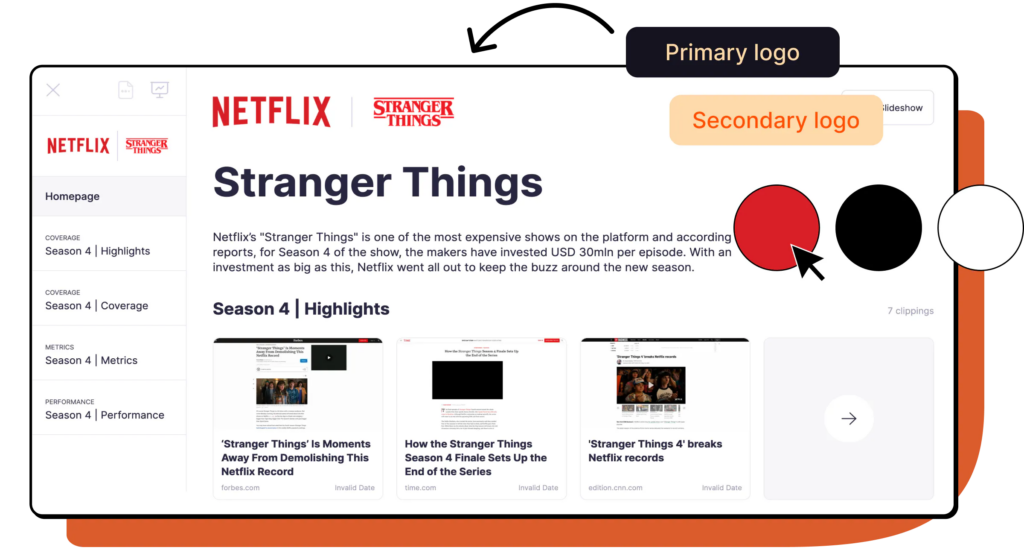
There are several pages in Prowly's coverage reports:
- #1 Home page - here you can customize the title and description, add your own logos, and change colors to match your brand's visual identity.
- #2 Coverage page - where you can automatically transfer mentions from Media Monitoring and paste any additional links you want, as well as offline coverage. All of these clippings will be evaluated and their statistics will be added to the metrics page. Prowly's PR Reports are connected to the Media Database, so just in case you're looking to add an author or the name of an outlet, Prowly’s analytics tools will find it in the database.
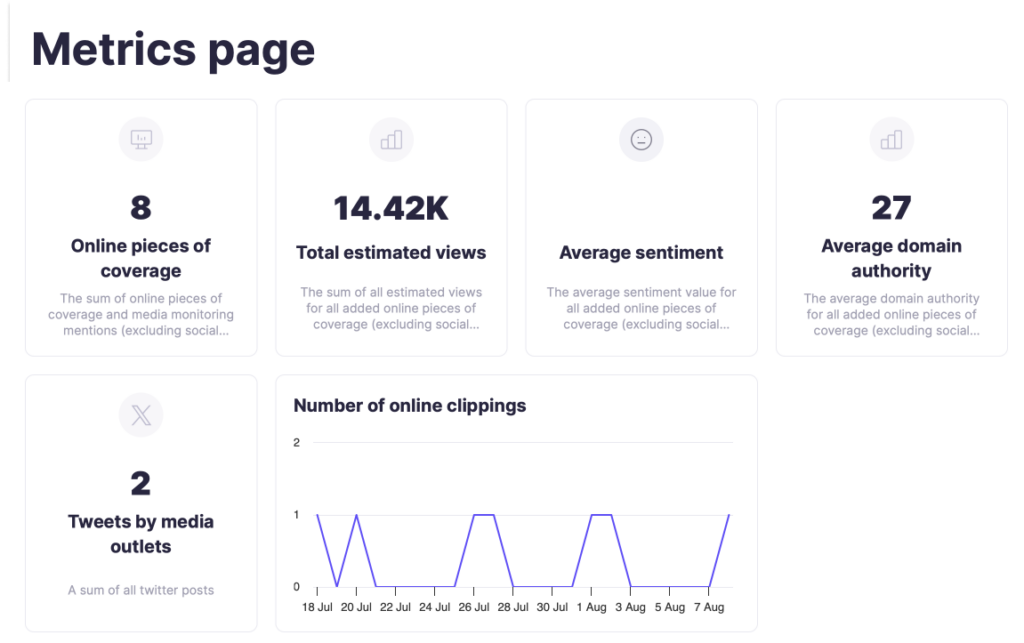
- #3 Metrics page - on this page, you'll be able to present any public relations analytics, important data, charts, and social media content. You can present the included coverage visually using metrics such as:
- Online and offline clippings
- Total estimated views
- Average sentiment
- Average domain authority
- Total AVE
- Total number of backlinks
- Social media statistics
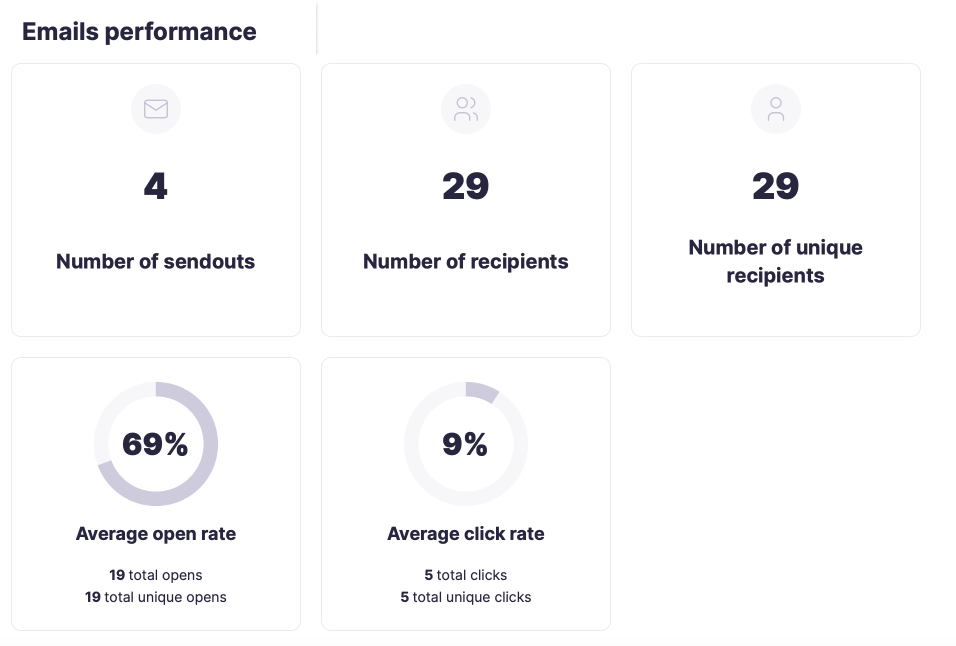
- #4 Performance page - this page offers options for showcasing email pitch statistics. You can either aggregate data by selecting multiple emails, which averages the data on the page or display the performance of individual emails by selecting one at a time.
- #5 Custom widgets - just in case there isn't a metric available, but you want to display a certain number, you can do so using custom widgets. For example, include conference attendees, number of tickets sold, etc.
Last, Prowly offers several ways to publish or share your report with clients and stakeholders. Whether you'd rather send it in a PDF, Excel, or PPT format, or publish it online with a link and password-protected access, you can choose how you want to send it out and show off your successes.
Here is a brief example of the kind of report you can do with Prowly’s PR Reports:
PR analytics tool #2: Muck Rack
| Provider | Pricing | Contract length |
| Muck Rack | From $10,000/yr* | Yearly only |
Muck Rack has a robust suite of PR metrics you can use. From AVE to SoV, you can also show the value of your strategy with a media impact analysis or competitive analysis. In terms of metrics, it’s safe to say they’re one of the best tools on the market.
One of the most talked about downsides when it comes to Muck Rack is their price. Smaller companies and agencies don’t usually have the budget to afford such a tool. Many reviews online have also said the tool might be hard to learn and it can be difficult to get help from their support team.
Need a bit more info? Check out this article about Muck Rack pricing or an in-depth analysis of Muck Rack alternatives.
PR analytics tool #3: Meltwater
| Provider | Pricing | Contract length |
| Meltwater | From $6,000/yr* | Yearly only |
Meltwater provides metrics on estimated views, reach, sentiment, AVE, engagement metrics from social media listening, and more. In comparison to other popular PR tools, Meltwater is one of the leading providers of metrics in public relations.
When it comes to the downsides, reviews say it might be a difficult tool to use and there’s a steep learning curve. One review even said that their high-volume data delay took 2 hours. Considering the urgency PRs need to work in, this is quite a long time (and something to consider).
Learn more about:
PR analytics tool #4: Cision
| Provider | Pricing | Contract length |
| Cision | From $10,000/yr* | Yearly only |
Cision is one of the best known PR tools on the market, with a long history of helping public relations professionals prove their value. They have dozens of brand metrics that can help you understand mention reach, unique views, and conversions when it comes to content such as downloads, page visits, purchases and more.
Reviews say Cision lacks reporting functions that can help PRs assess their strategies against their competitors and that the new version of the interface isn’t as user friendly as the old one.
Learn more about:
PR analytics tool #5: Propel
| Provider | Pricing | Contract length |
| Propel | From $2,300/yr | Yearly only |
According to their website, Propel can help you analyze things such as website traffic, online purchases, and form completions. You can also get a closer oversight on the number of articles published, pitching metrics, and others.
However, if you’re looking for an all-in-one tool, reviews say that their database lacks contacts and users had a difficult time building lists. Some also said the tool is a bit buggy here and there and their UI might be confusing.
PR analytics tool #6: Prezly
| Provider | Pricing | Contract length |
| Prezly | From $90/mo | Monthly or yearly |
Prezly is an all-in-one tool that offers campaign analytics. You can check which contacts are the most engaged with your press releases and report on coverage using another of their features.
Although the tool looks promising, reviews say the tool isn’t as intuitive as they’d like it to be. Users say there’s little wiggle room for things like fonts and formats in email sections and not enough options for personalization.
PR analytics tool #7: Agility PR
| Provider | Pricing | Contract length |
| Agility PR | Undisclosed | Yearly only |
Agility PR is big on media analysis and pulling data from media monitoring. It helps evaluate traditional metrics, such as AVE, and examine more in-depth ones to see the value in brand awareness, engagement, reputation and more.
When it comes to the negatives, reviews say their UI could be improved for more efficient workflow. In addition, they say the website can be a bit slow. While this isn’t a dealbreaker, it’s important to be able to use your tool with ease, especially when it comes to the work you do, and you don’t have time to spend hours on learning a tool.
PR analytics tool #8: CoverageBook
| Provider | Pricing | Contract length |
| CoverageBook | From $99/mo | Monthly or yearly |
This platform is one of the most popular coverage reporting tools on the market. It has features that make it easy for users to simply insert links from your coverage and lets it do all the work, including tracking readership numbers and estimating an article's total reach.
While it's awesome for reporting, users say it can sometimes get glitchy or clunky when both importing links and editing. It also doesn't provide media monitoring, which means you'd have to manually enter clippings into the tool in order to get a report ready.
Although it's a great tool, it's not an all-in-one for PR professionals and only offers reporting capabilities.
For a more in-depth comparison, check out this article comparing Prowly, Releasd and CoverageBook.
PR analytics tool #9: Releasd
| Provider | Pricing | Contract length |
| Releasd | From $154/mo | Monthly or yearly |
Releasd offers user-friendly, drag-and-drop layouts for PR reporting and efficiently pulls coverage from websites and social media platforms onto a single, easily digestible page. They also have automated metrics and highlight their unique "coverage impressions" as a key feature.
While they do have a 15-minute demo to showcase the product, they don't offer a free trial. Additionally, according to user reviews, the tool is said to have poor customer service, difficulties in adding images, and not enough analytics tools to gain deeper insights into readership.
Conclusion
Selecting the right PR analytics tools is crucial for gaining deep insights into your brand's or competitor's media presence. An ideal analytics tool should not only collect data but also analyze it across multiple metrics, like sentiment, share of voice, audience reach, and others, to help form a complete picture of your PR impact.