

If you're overwhelmed by the sheer volume of time and effort it takes to create media reports, you're not alone. Many PR professionals find themselves drowning in data, struggling to pull together information from a myriad of sources.
What is a media monitoring report?
Media monitoring report is a document that analyzes coverage received from a particular campaign, topic, company, or event across different media platforms.
It should provide insights about the reach and importance of the media coverage, as well as relevant data. In a nutshell, a media report is meant to evaluate the effectiveness of your communications and public relations strategy.
The process doesn't just stop at data collection though. The biggest pain point of all comes when you have to translate all this data into insights that make sense. How can you show the value of your PR activities to clients and stakeholders in a way they can understand?
In this blog post, we'll guide you through the process of creating captivating, efficient, and useful media reporting documents. Collecting data and insights doesn't have to be burdensome, and with the right PR tool, it can become just another task you need to do at the end of every campaign or quarter.
Why do you need a media report?
Simply put - to demonstrate the value and impact of your work to your supervisor, client, or stakeholders. Numbers and concrete data displayed in a media report offer tangible evidence of the effectiveness of the media strategies you have implemented. Therefore, they're the best way to prove that what you've been doing works.
By analyzing media coverage, market trends, public sentiment, and other industry-relevant metrics, you can provide insights that support the strategic decision-making process and justify budgets. Plus, media reporting helps to make informed and data-based adjustments, making sure objectives are met efficiently and effectively.
Here are some examples of popular media reports:
1. PR campaign report
Here, you'd naturally provide details of outreach efforts, the number of people you've emailed, email analytics, the media coverage you've scored with relevant links, their reach, audience engagement, sentiment, and more.
It's sort of a media reporting document, so you're summarizing all the mentions you've received in a given period of time.
Such a media report helps clients and stakeholders quantify your work, and see a direct correlation between public relations activities and outcomes, for example, brand awareness, improved public perception, market position, and so on.
2. Competitor analysis report
In a media monitoring report focused on competitors, you should investigate their strategies through metrics from their media presence, PR tactics, successes, failures, and most of all - social media engagement.
Depending on where your audience hangs out, you might want to do a separate social media monitoring report to ensure the information you're giving is clear and easily consumable.
Media monitoring analysis reports focused on your rivals provide invaluable information to clients and stakeholders on why your strategy involves certain tactics.
For example, even though your target audience frequents Instagram more than Facebook, you've maybe planned to conquer that channel as well because no one else is out there. Or, maybe your competitor is viewed positively on Instagram by curating their comment section as much as they can, but the community whispers negative feedback on Reddit.
3. Crisis management report
A crisis media report should be based on facts and evidence, not opinions or speculation. It should provide accurate and up-to-date information about the event itself, its impact on the media landscape, and what has been done about it.
Whoever you're bringing this report to wants to know the exact numbers, read some of the comments made, and skim through bylines.
Then, make sure that you're including a summary of what has happened, including gaps, errors, and things that could be done better next time, such as ideas on reactive crisis management strategies. By being transparent and bringing everything to light, you're committing to credibility and accountability with your clients and stakeholders.
4. Other media monitoring analysis reports
The reason for a media report depends on what you've been doing.
You can use it to showcase the company's corporate social responsibility initiatives and its impact on the community, show how a recent win during industry award ceremonies has shaped the public discourse, or even report on audience sentiment when announcing a new executive or a key team member who has recently joined a campaign or the company. Media monitoring report examples are absolutely limitless in that sense.
What data should be included in your media report?
A data-filled media report is crucial in providing valuable insights into the reach and impact of your work. To make the most out of these reports, you need to know what data should be included in them.
From general metrics such as article reach, to more in-depth analysis such as SoV between you and your competitor, all the information must be there in a way where it will make an impact on the reader.
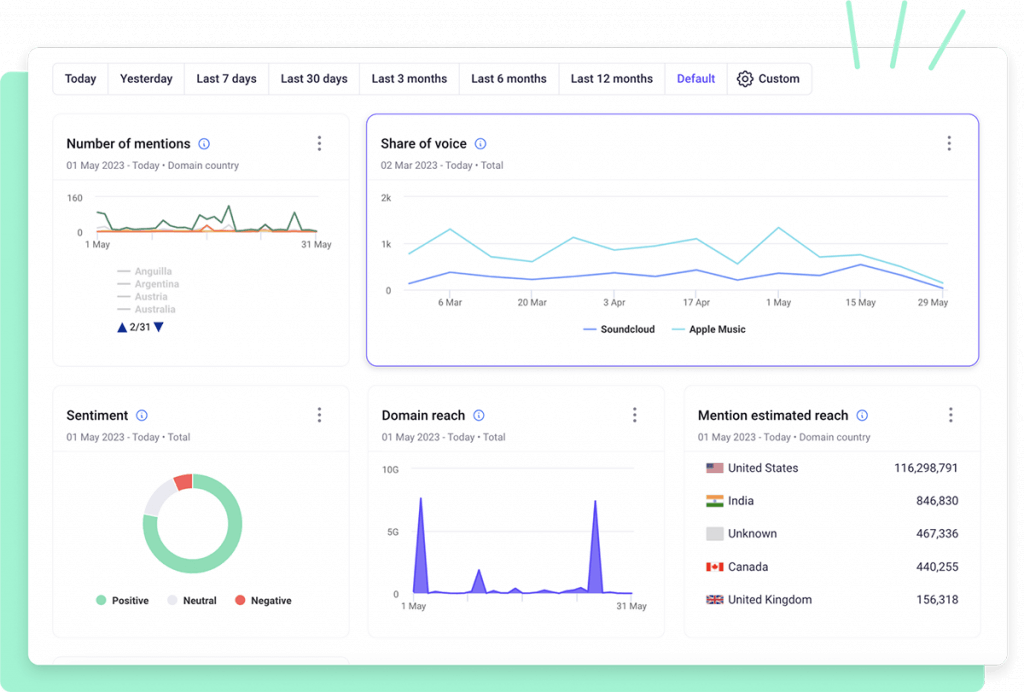
Media coverage report
Who mentioned you in the press? Did you make sure to pick up all the mentions, even from journalists who you've reached out to, but never heard back from?
The wider your reach, the more you will "wow" your client. Include information such as:
- Estimated reach
- Impressions
- Mentions from target outlets
- General sentiment
- Outlet's domain reach
- and more
Ideally, you'd want to show this information in a digestible form. If you write it all out, but it will be unreadable to your boss, they will not easily understand what these numbers might mean. You might want to look at a media monitoring report sample to see what works best for certain metrics.
When you go to the Media Monitoring module in Prowly, you’ll see fully customized dashboards with all the data, and recommended graph formats for each metric, so that your data is shown in the best way possible.
Social media report
We know that social media make the world go round by now. It's nearly impossible to be a brand, and not generate any kind of social media buzz, whether it's huge or just an industry whisper. If you're not creating social media report summaries by now, then you might want to catch up so you don't get run over by your competitors.
The most important thing is to collect valuable information about your top-performing posts, people who have been an active part of the community, journalists who have had an interest in your brand because of the social media buzz, and so on.
One of the ways to do this is to create queries with keywords you're interested in. Let's say you want to create a media report on your latest new product launch. In addition to jotting down the outlets that have mentioned you, you want to see if socials brought in anything as well.
You can measure sentiment in each social media channel, and compare how many mentions you've received in let's say, LinkedIn vs. Instagram. That way, moving forward, you'd be able to assess whether your current strategy is working.
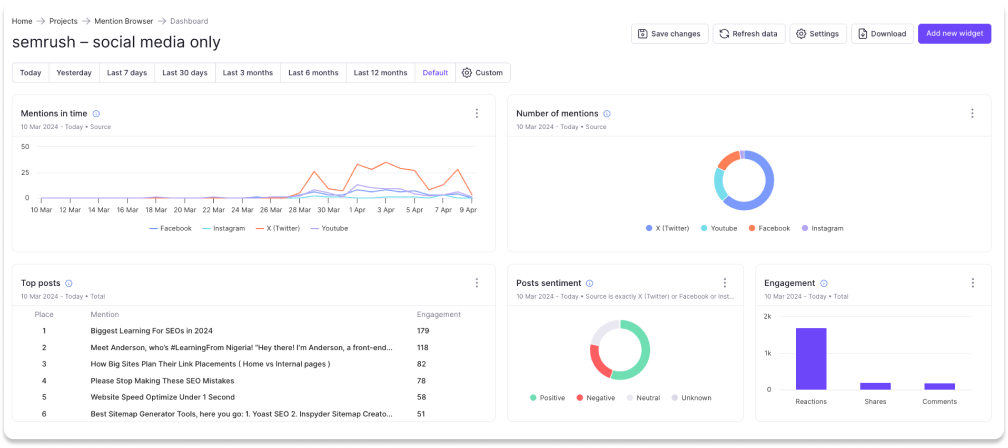
In addition, you can also report on a particular hashtag you've used for a campaign. Or track engagement around posts with a certain keyword, person, or brand, and report back on who got the biggest number of comments or social shares.
Discussion forums
Just like social media, discussion forums such as Reddit are powerful in terms of recognizing what your audience is really interested in. Were they excited about your recent partnership with a charity, or did they see it as a performative action on your end? Maybe your brand has been scolded by a popular influencer with hundreds of thousands of followers, but the Reddit community doesn't follow it and is actually there to defend you.
If you're not searching through discussion forums to then later include information in media reports, you might be missing out on lots of information that can potentially help you mitigate a brewing crisis, or help you adjust your strategy in the future.
How to organize data in media reports?
In this section, we'll deep dive into organizing data in your media reports. To be quite honest, it's a pretty big deal and requires an eye for detail. The better you place the information you want to show here, the better your boss will understand the impact you've made.
A brief summary
Think of this part of your media report as the cornerstone for what will come next. It's also a lifesaver for busy clients and stakeholders, who don't really have all the time in the world to go through every single page and clipping, but still want to get the gist of it all.
Here, you want to aim to spotlight all the juicy bits of the report, such as how many articles got published, where they got featured (socials, magazines, etc.), the number of social shares, and estimated reach. Plus, don't forget to throw in any big wins you'd love them to notice right off the bat.
A lot of PR specialists wrap up their media report summary by highlighting their key achievements. However, that might be a missed opportunity, since your boss will also probably want to see what you make out of this analysis, and what steps you'd like to take next. So go ahead, and show them what you've got up your sleeve in the future.
Although a media report summary is at the forefront of all media reports, you'll probably write it last. That's totally common since it's better to write the meaty parts first and note down any things you'd like to display first.
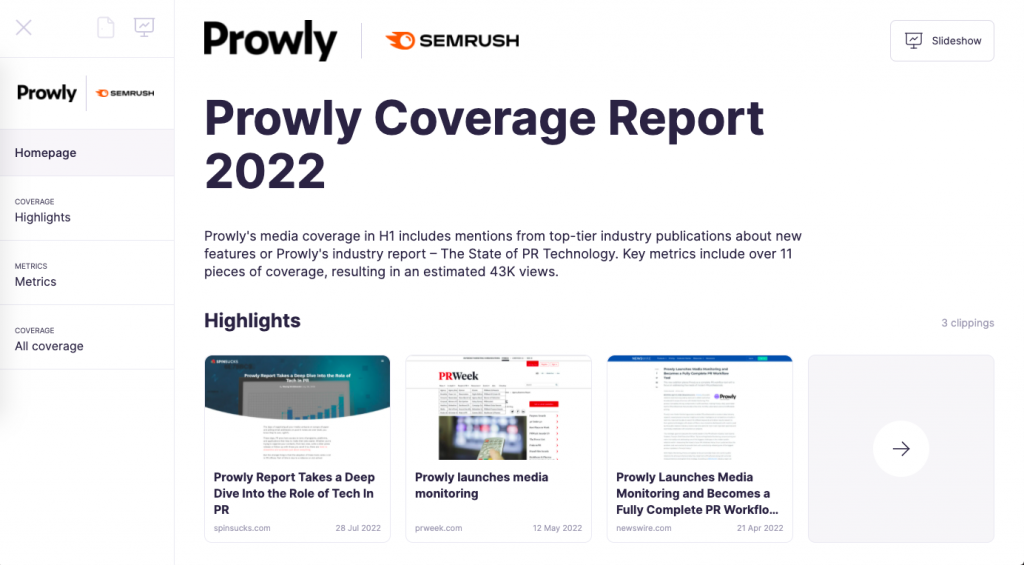
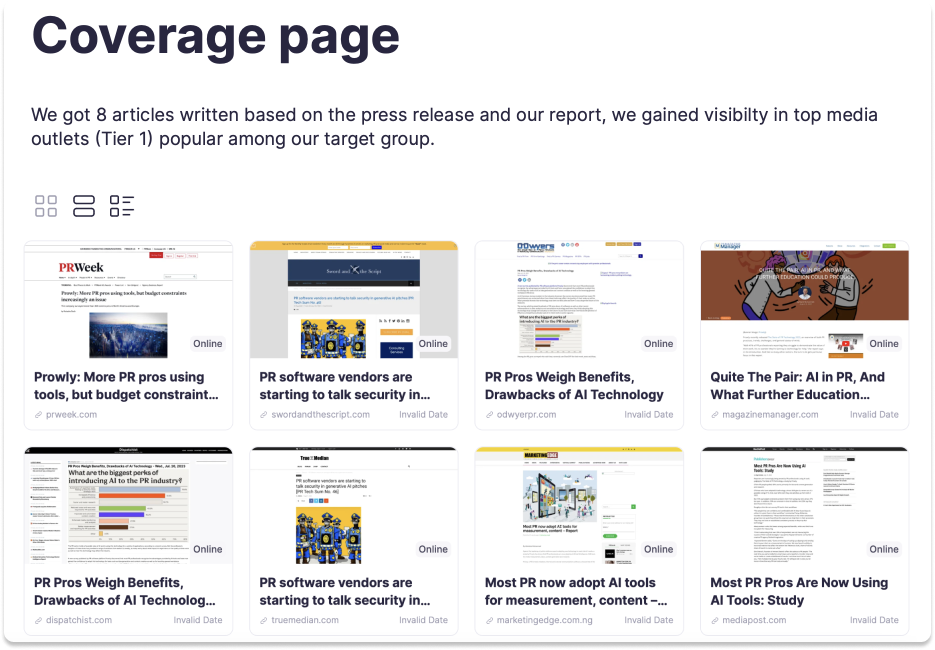
Coverage page
Here comes the secret sauce to any media report - a coverage page with all the clippings. Make sure to keep your top-notch media coverage separately, so that it doesn't get lost between the less important mentions.
With every single clipping, provide the reader with information such as publication date, a working web link, the monthly estimated reach for the outlet, and estimated views the mention has received.
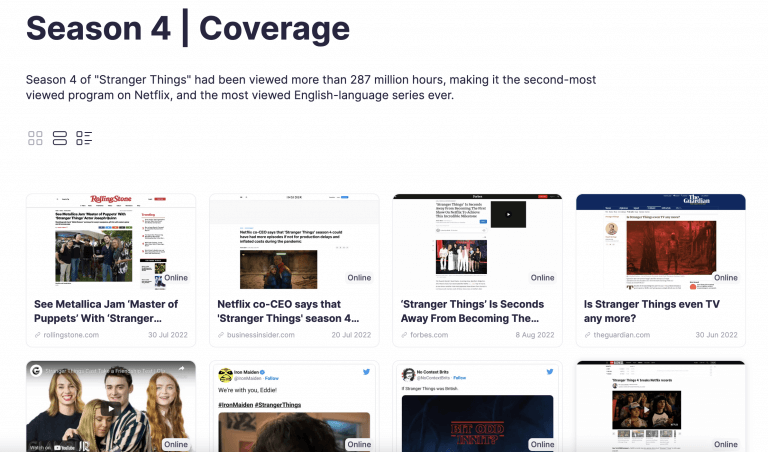
For bonus points, include backlinks to your client's website in all of your media reports. While it's rare that a journalist would do this, there might be additional coverage from other less-desired media that did, indeed, link to your page.
Also - don't forget about social shares. If the article gets shared on social media, it's a win-win situation, giving you more traffic, credibility, and a better reputation for your clients.
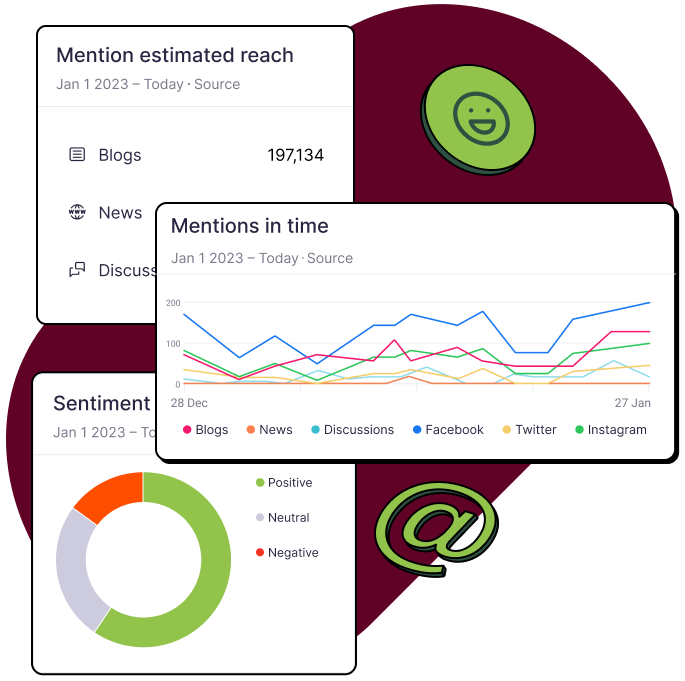
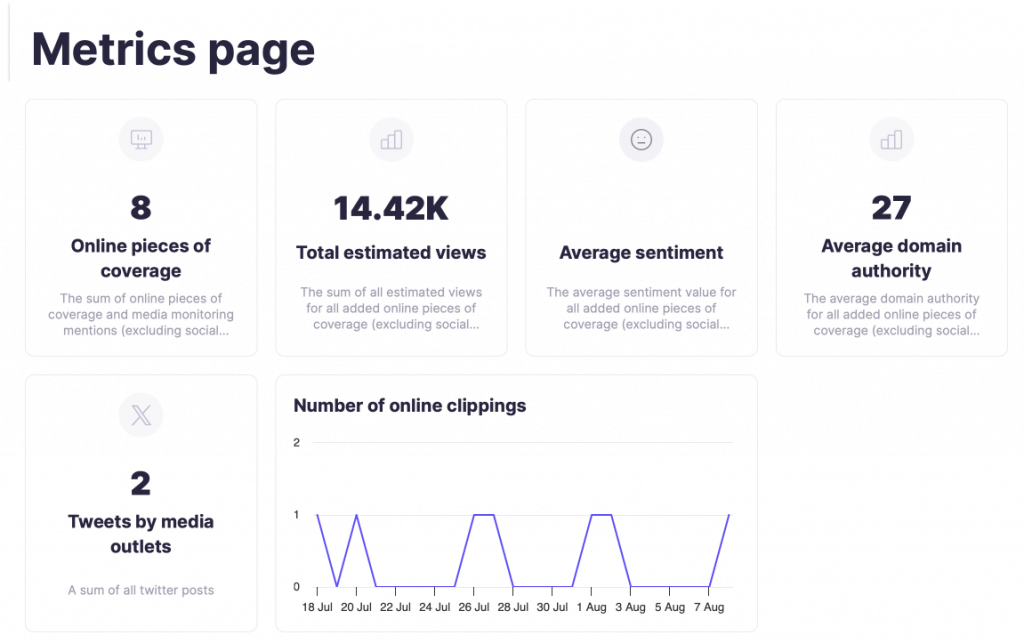
Metrics page
In some cases, media reports will only include coverage, and that’s all. However, a data-driven approach yields much better results, especially if you show more than just links to articles. With Prowly, it’s easy to get those metrics automatically and prove the value of your PR work without hassle.
It's worth noting here that while AVE is commonly used as a metric, it's not fully credible. However, because there is a lack of alternative metrics that are similar in nature, it's still widely used.
Generally, possibilities for showing a metrics page are limitless and depend on your campaign. For example, you can use comparison graphs, to show a side-by-side visual about the performance of the current campaign and the previous one based on their Share of Voice, or any other metric you want to use.
Here, you will want to include the number of online pieces of coverage, the number of social shares, estimated views, average sentiment, domain authority, and more.
Email performance page
What's worth including is also how your outreach has performed. An email performance media report sample provides crucial insights about the impact and effectiveness of your overall story and email message. Key metrics such as open rates and click rates are integral to understanding how well your audience is engaging with your content.
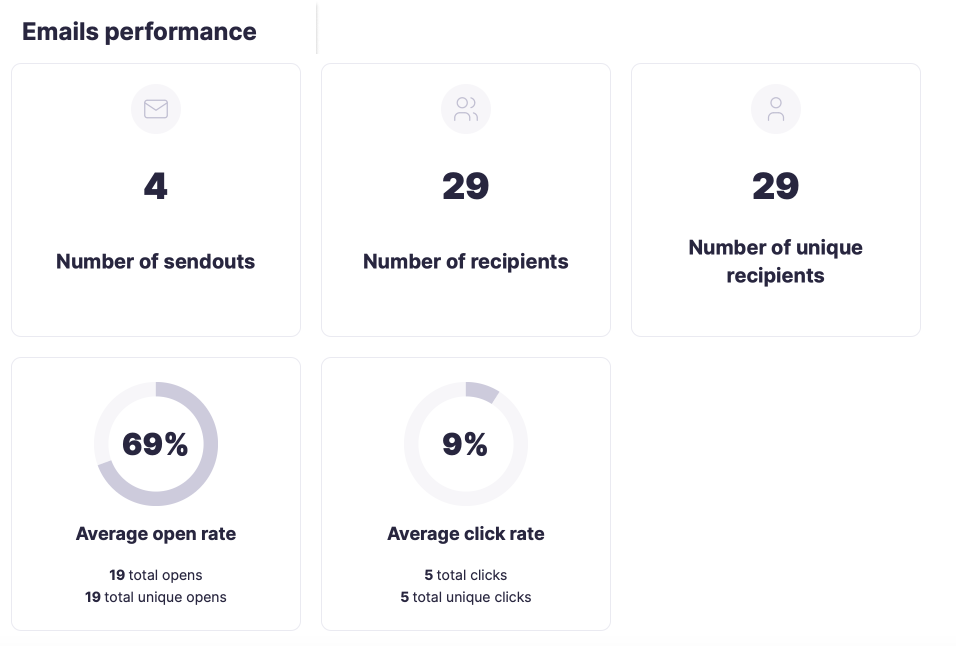
Open rates can reveal how compelling your subject lines are, and click rates indicate how effective your story and CTA's may be. Comparing this outreach to previous ones allows you to gauge progress, identify trends, and make data-driven decisions for future strategies.
By leveraging these insights, you can continuously optimize your email campaigns for better engagement and results, as well as show your clients and stakeholders the hard work you've done that allowed you to achieve the publications you wanted.
When can you use a media report?
There are so many different media monitoring reports you can use. From showing a straightforward coverage report on your latest campaign to sharing important updates regarding a particular topic.
Let's say your company has hosted a public event, and you're looking to summarize its results in terms of media reporting. Not only that but maybe you've finally secured an answer from a journalist you've been running after for months thanks to that particular event.
Or, you can also report on media buzz caused by the client's involvement in a charity, which shows social responsibility and their commitment to causes the community cares about. In turn, their sentiment could have turned from neutral to overwhelmingly positive.
No matter the occasion, a stellar media report can really take your career to new heights if it catches the eye of your boss.
How to prepare a media report with Prowly?
Media reporting at Prowly is easy, intuitive, and as automated as possible. That way, you can speed up your workflow and show off the impact you've had on the brand.
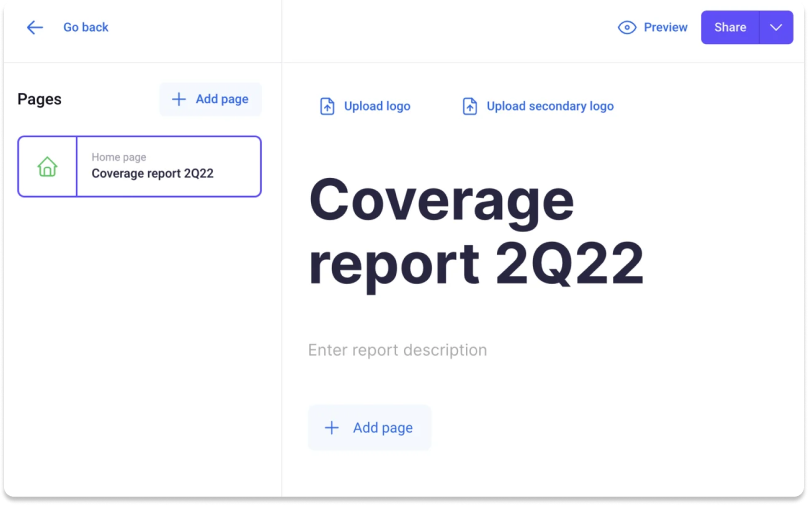
Start off by creating a new report
Simply go to the PR Reports module, and create a new report. There can only be one "Home page" where you would display your most important information, but there's an option to create as many pages as you need within the report itself.
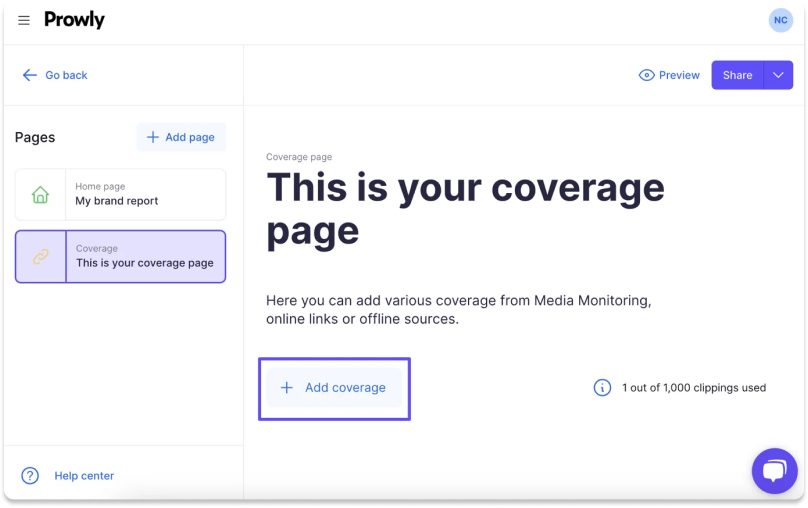
Add a coverage page
Here, you can add clippings from URLs where you can manually copy and paste links from online articles or social media posts, as well as import them directly from Excel or Google Sheets. You can also add highlighted mentions automatically from Prowly's Media Monitoring, or upload offline coverage such as an important feature in a local newspaper.
What you can do to improve your media reporting game, is include an additional coverage page for the most successful mentions. That way, they won't get lost in the mix and the reader will be able to spot them without searching through the entire report.
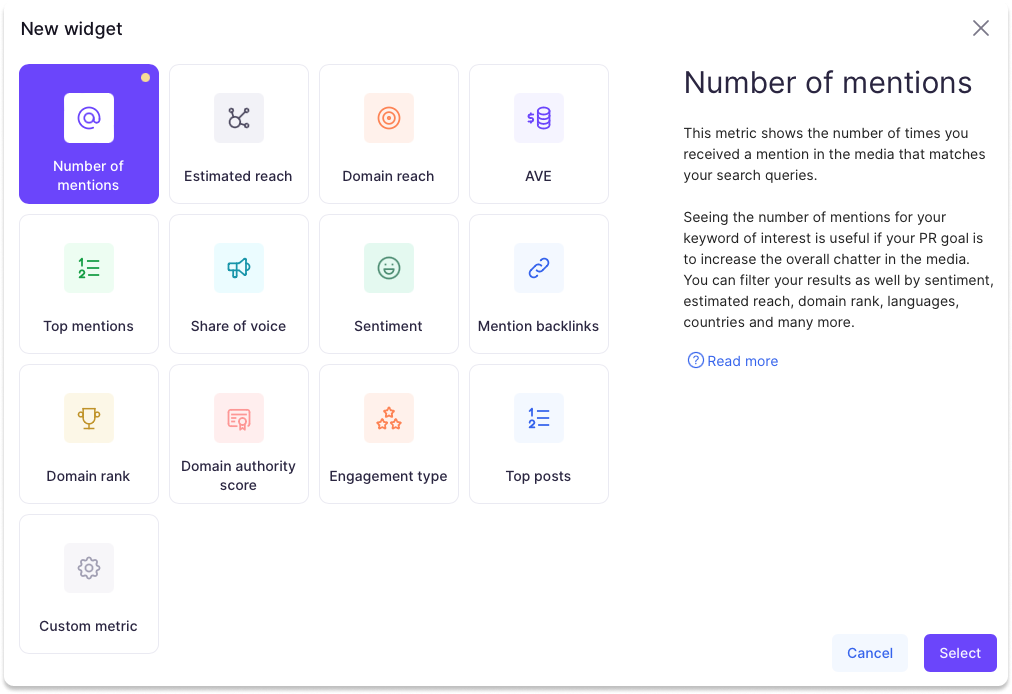
Last, add a page with metrics
Numbers over everything, right? In this section of your coverage report, you can add concrete metrics to the mix. From the number of online pieces of coverage to estimated views, average sentiment, total AVE, or even the total number of backlinks.
Keep in mind that using metrics effectively can be the best way to show the impact you've made. That's why with Prowly, you can show your data visually using different types of charts, including bar, column, donut, or line charts. Additionally, you can add your own metrics in the form of widgets, such as the number of downloads for a survey, the number of press conference attendees and so on.
Don't forget to add an email performance page as well, where you'll get the number of emails you've sent, open rates, click rates, and other equally important email engagement and outreach metrics.
Conclusion
To wrap up, a good media report is like a secret weapon to any seasoned PR pro. It shows the results of your hard work and gives the reader insights into media coverage, what people are saying, and milestones you may have achieved.
These, in turn, can help you make smart decisions, justify budgets, and tweak your plans here and there to hit your goals more efficiently. Media reports can be tailored to fit any need, and with the right PR tool, creating one doesn't need to be the task you're dreading.